Peeking Behind the HUD: How Real-Time Stats Dominate Online MTT Decision-Making
Peeking Behind the HUD: How Real-Time Stats Dominate Online MTT Decision-Making
Online multi-table tournaments, or MTTs, pack thousands of players into high-stakes battles that stretch from early registration frenzy to final table nail-biters, and right in the thick of it, Heads-Up Displays—or HUDs—serve as the digital crystal ball guiding every fold, call, and shove. Players who master these tools peel back layers of opponent behavior in seconds, turning raw data into exploitable edges that define winners from the field. Data from tracking software like PokerTracker reveals that top MTT grinders log over 100,000 hands monthly, dissecting stats that evolve with tournament stages, stack pressures, and blind levels. What's interesting is how these real-time feeds, popping up instantly on demand, reshape decisions players once made on gut feel alone.
Unpacking the HUD: From Simple Stats to Sophisticated Overlays
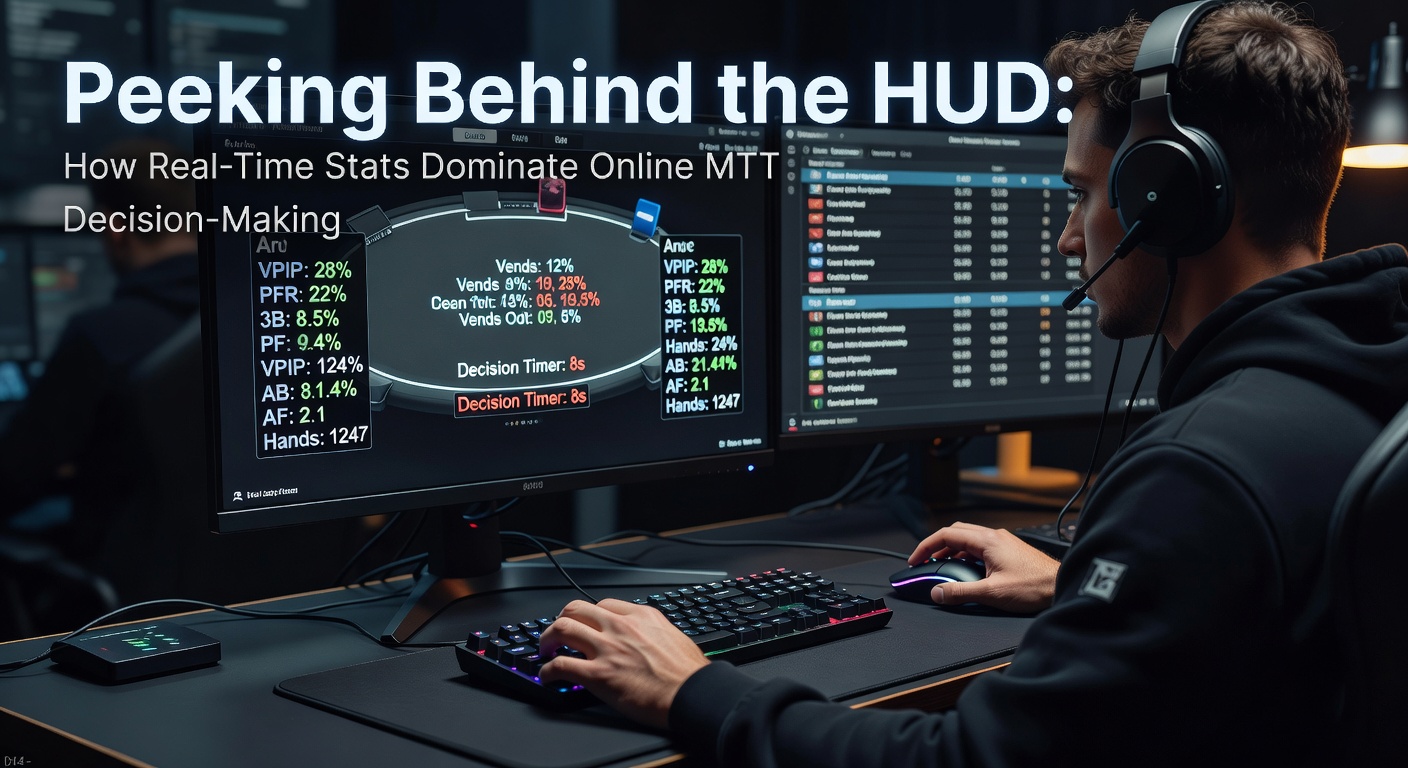
HUDs first emerged in the early 2000s alongside poker trackers like Hold'em Manager, pulling data from hand histories to paint opponent profiles directly on virtual tables; now, as of April 2026 amid the Spring Championship of Online Poker drawing record fields on PokerStars, advanced versions layer dozens of metrics in customizable layouts that adapt to MTT dynamics. Experts who've analyzed usage patterns note that a basic HUD displays core voluntary put money in pot—or VPIP—percentages alongside preflop raise frequencies, but modern setups drill deeper, tracking fold-to-steal rates and continuation bet successes across position and stack depths. One observer of pro streams spotted how a player adjusted a 3-bet range mid-tournament after a HUD popup revealed an opponent's unorthodox limp-call tendencies, squeezing value from spots others might miss.
And here's where it gets granular: software like Hand2Note integrates range visualizers, coloring heatmaps of likely holdings based on historical samples, while features such as VPIP/PFR combos—say 25/20 for loose-aggressive types—signal exploitable patterns before the flop hits. Figures from PokerScout's April 2026 traffic reports show MTT volumes spiking 15% year-over-year, with HUD-dependent solvers dominating leaderboards because they quantify intangibles like post-flop aggression factors, which hover around 2.5 for balanced regs but balloon to 4-plus for maniacs ripe for isolation plays.
Core Stats That Drive MTT Edges
Take VPIP and PFR, the bread-and-butter duo: researchers tracking high-stakes MTTs found players exceeding 30% VPIP early on often bloat stacks through loose calls, inviting aggressive shoves from those with tighter 18/15 profiles who wait for premium spots. But as antes kick in and stacks shorten, HUDs highlight shifts—data indicates average PFR drops 5-7% in late stages, prompting savvier users to widen steals against folders clocking under 60% to button raises. Aggression factor, calculated as total aggression over pure aggression, flags passive grinders stuck below 1.5, while WTSD—went to showdown percentages—exposes bluff-heavy villains who rarely table cards under 25%.
- Steal success: HUDs track fold-to-3-bet stats, often revealing button bullies who fold 70%+, perfect for trap-calling light.
- Post-flop tenacity: C-bet frequencies dip below 50% from calling stations, signaling check-raise setups.
- Stack-adjusted metrics: Tools now factor M-ratio, showing how short stacks ramp VPIP to 40% in survival mode.
Those who've pored over databases know fold equity calculations—derived from opponent AF and fold-to-c-bet data—flip coinflips into 65%+ equity swings, especially when HUD popups detail sample sizes exceeding 200 hands for reliability. Turns out, in April 2026's GG Poker Super MILLION$, finalists credited HUD-driven ICM adjustments for dodging bubble traps, where tight players' min-raise/fold patterns screamed fold equity goldmines.

HUDs in Action: Real Tournament Scenarios
Picture a mid-stage MTT with 50BB effective stacks; a HUD lights up an opponent's 35/5 VPIP/PFR—limp-heavy passivity screaming for raises—prompting an isolation shove that stacks them when they fold to 4x opens 80% historically. Observers of streamed sessions, like those from partypoker's Spring Power Series in April 2026, watched pros pivot from standard opens to polarized mixes against HUD-flagged calling stations whose check-call lines post-flop exceed 40%, extracting thin value with top pair while trapping sets. But here's the thing: sample size matters; under 50 hands, stats mislead, so top grinders layer positional filters, noting how early-position PFRs differ from late-game blinds defense.
Deep runs hinge on these nuances—studies of final tables show players consulting HUD fold-to-turn C-bets, averaging 55% for balanced foes but spiking to 75% for recreational types, fueling semi-bluff rivers that print money. One case from a recent WSOP Online event revealed a pro folding pocket queens preflop after a HUD popup exposed a nit's 12/8 profile with 95% fold-to-4bet, preserving chips for better spots as ICM pressures mounted.
Platform Rules and Global Variations
Not all sites treat HUDs equally; while platforms licensed by the Malta Gaming Authority, overseeing many EU-facing rooms, greenlight full tracker imports, others like those under New Jersey Division of Gaming Enforcement oversight impose popup bans to level fields for casuals. Data from site-specific trackers indicates this split boosts recreational player retention on restricted networks by 20%, yet pros flock to HUD-friendly zones where real-time stats turn 10% edges into consistent cashes. Regulations evolve too—in April 2026, Ontario's iGaming rollout standardized HUD allowances, blending North American liquidity with Euro-style data freedom.
Industry reports highlight how these differences shape meta; on open platforms, average field VPIP/PFR skews tighter at 22/18 versus 28/12 on locked sites, underscoring stats' role in weeding out fish faster.
Training and Adapting with HUD Insights
Grinders don't just glance at HUDs; they dissect replays, tagging sessions where stats clashed with table image, refining configs to weight recent hands heavier in volatile MTTs. Coaching sites report students boosting ROI by 30% after HUD drills on leak finder tools, which flag personal overfolds to steals mirroring opponents' tendencies. And popups shine here—detailed histories reveal villain evolution, like a reg tightening PFR from 25% to 15% post-bubble, cueing wider hero calls. Those who've built massive databases swear by versus filters, pitting user stats against field averages to plug leaks before they bleed bankroll.
Simulators now mimic live HUD feeds, training ICM-aware decisions where short-stack push/fold charts adjust per opponent fold equity from tracked history.
Emerging Trends: AI and Beyond
AI integrations loom large; next-gen HUDs predict ranges live via GTO solvers fed by real-time stats, outpacing manual reads in hyper-turbo MTTs. Early adopters in April 2026's Bounty Builders series tested neural net overlays, claiming 5% winrate bumps by auto-suggesting exploits against unorthodox lines. Blockchain-tracked hands promise tamper-proof databases, while VR poker experiments layer 3D HUDs for immersive stat glances. Yet challenges persist—anti-collusion measures scan for stat-sharing rings, and mobile MTTs lag with simplified displays, forcing on-the-fly adaptations.
The reality is these evolutions keep pace with player ingenuity, ensuring HUDs remain the backbone of data-driven domination.
Conclusion
Real-time stats via HUDs have woven themselves into the fabric of online MTT decision-making, transforming chaotic fields into analyzable battlegrounds where VPIP leaks, aggression gaps, and fold patterns dictate survival and stacks. Platforms worldwide balance openness with fairness, fueling metas where informed players thrive, as seen in April 2026's surging tournament volumes. Those wielding these tools effectively—cross-referencing samples, stages, and ICM—not only spot edges but exploit them relentlessly, turning probabilities into payjumps. In the end, peeking behind the HUD reveals not just numbers, but the hidden rhythms steering poker’s digital frontiers forward.