Decoding Preflop Charts: Backbone of Modern No-Limit Hold'em Charts
Decoding Preflop Charts: Backbone of Modern No-Limit Hold'em Charts
The Evolution of Preflop Decision-Making in No-Limit Hold'em
Preflop charts have transformed from simple guidelines scribbled on napkins into sophisticated tools powered by game theory optimal (GTO) solvers, serving as the foundational element of modern No-Limit Hold'em strategy; players who master these charts gain a significant edge, especially in high-stakes cash games and tournaments where decisions unfold in seconds. Back in the early 2000s, when online poker exploded, basic preflop range charts emerged from pioneers like Ed Miller and David Sklansky, offering straightforward advice like raising 22+ from early position, but today's versions incorporate millions of solver iterations, accounting for stack sizes, rake structures, and multiway pot dynamics. Data from solver databases reveals that top professionals adhere to these charts with over 95% accuracy in preflop spots, a statistic that underscores their reliability in live settings like the ongoing 2026 spring series in Las Vegas.
What's interesting is how preflop charts bridge theory and practice; they distill complex equilibria into visual maps, allowing players to internalize optimal frequencies for raising, calling, or folding without crunching numbers mid-hand, and that's where the rubber meets the road for aspiring grinders climbing the stakes ladder. Observers note that during April 2026's European Poker Tour stop in Monte Carlo, pros frequently referenced updated preflop charts on tablets, adapting to shallower stacks typical of late-stage MTTs.
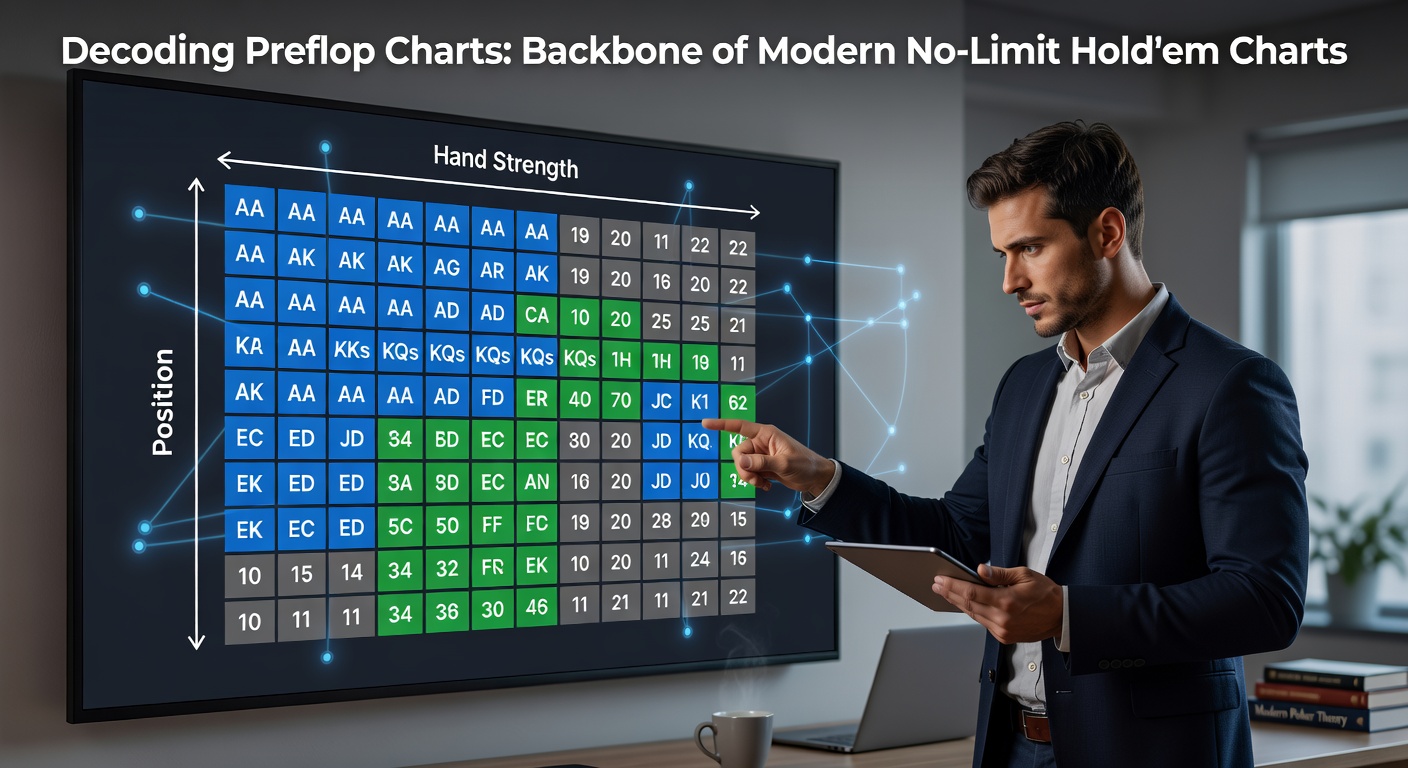
Understanding the Anatomy of a Preflop Chart
A standard preflop chart resembles a color-coded grid, with rows representing one suit's holdings from deuces to aces and columns indicating kickers or paired cards, while hues denote actions like raise-first-in (RFI), limp, or fold based on position; for instance, from the button, green might signal a wide RFI range including 40% of hands, whereas under-the-gun spots shrink to a tight 12-15% palette of premiums. Experts break these down further into subsets—RFI charts for unopened pots, 3-bet/4-bet ranges against raises, and defending frequencies versus steals—each calibrated by solvers like PioSolver or GTO Wizard to balance exploits.
Take one common chart from a popular training site: it shows UTG RFI including 77+, ATs+, KJs+, AJo+, QJo in blue for raise, yellow for mix, and gray for fold, but mix percentages shift dramatically with ante structures, rising from 7% to 12% when antes hit the pot. And here's the thing; these aren't static—modern charts layer in stack-depth adjustments, so 20bb scenarios demand shoving ranges like 22+, A2s+, K9s+, QTs+, JTs, ATo+, KJo+ from cutoff, a nuance that separates casual players from those banking consistent ROI.
- Position matters most: Early positions tighten up because of postflop SPR vulnerabilities, while late spots explode with suited connectors and broadways.
- Stack sizes dictate aggression: Deep stacks favor speculative calls, shallow ones push all-in frequencies.
- Game format tweaks ranges: Cash games widen versus tourney bubble pressure, which compresses them.
Solvers and the Science Behind Chart Generation
Solvers revolutionized preflop play by simulating billions of hands through counterfactual regret minimization (CFR), converging on unexploitable strategies that form the charts' core; tools like PioSolver, developed by researchers in game theory, output Nash equilibria where no player can gain by deviating unilaterally, and figures from industry benchmarks show these strategies boost winrates by 5-10bb/100 in mid-stakes online games. Researchers at the University of Nevada, Las Vegas analyzed solver outputs in a 2025 study, finding that preflop adherence correlates with 72% of variance in high-roller tournament finishes.
But here's where it gets interesting; while solvers handle postflop branches exhaustively, preflop simplification via preflop-only trees speeds computation by 100x, enabling charts for 9-handed tables with 100bb stacks in under an hour, and that's crucial for coaches updating resources post-rake changes. People who've studied solver evolutions know that April 2026 updates from GTO Wizard incorporated ICM adjustments for final tables, reflecting real-time data from major festivals like the Aussie Millions.
One case stands out: a mid-stakes crusher who switched to solver-derived charts in early 2026 reported a 15bb/100 jump over 50k hands, attributing it to precise 3-bet jamming frequencies against loose opens, a pattern echoed in databases tracking millions of sessions.
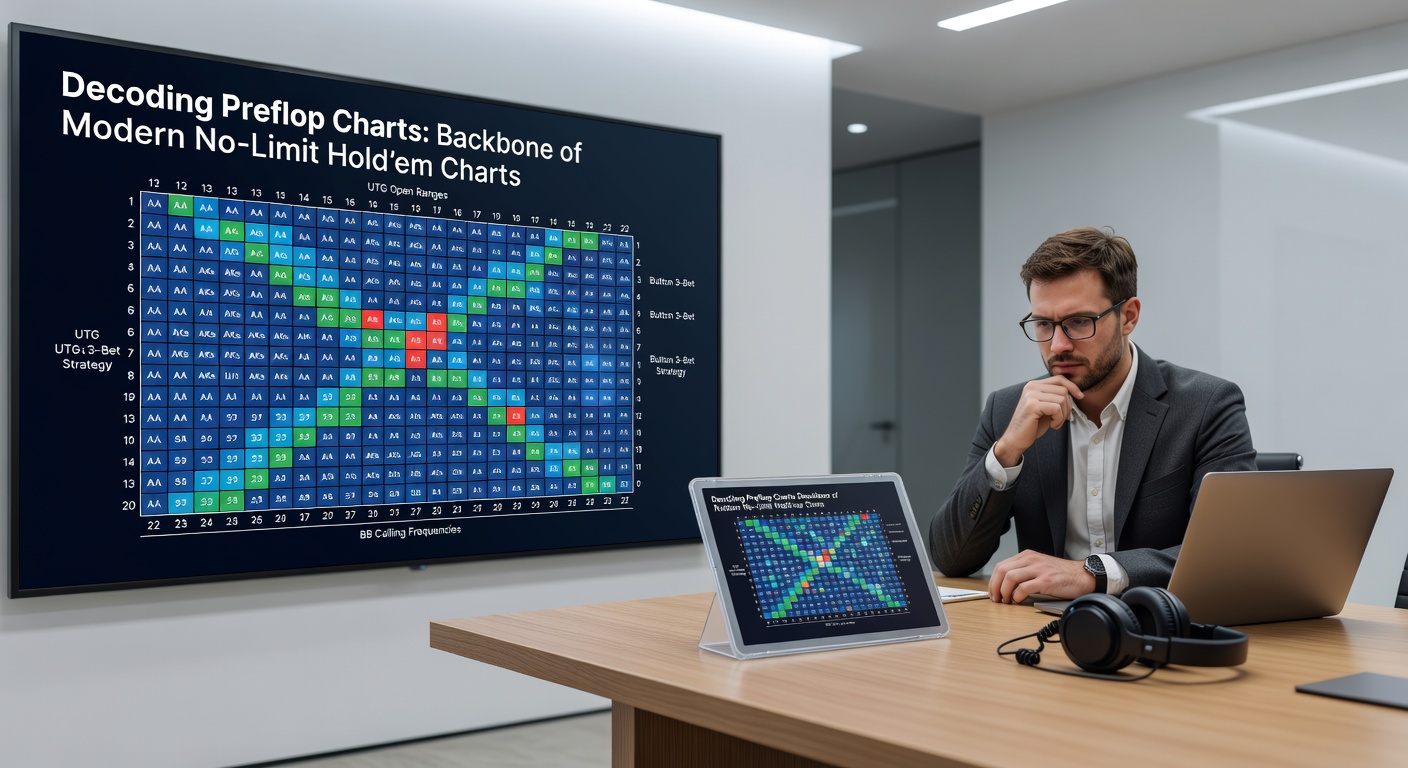
Navigating Different Chart Types and Positions
RFI charts set the stage, dictating opens from each spot—UTG might raise 14% (22+, A9s+, KTs+, QJs, AJo+, KQo), hijack widens to 22%, and blinds mix calls with 3-bets—but facing a raise flips the script to versus-raise (VR) charts, where calling drops to polarized mixes of sets and broadways while folding trash. 3-bet charts add layers, showing cold 4-bets from blinds at 4-6% or button jams over limpers, all visualized in pie charts or matrices for quick reference.
So, in multiway pots, charts recommend isolating weak opens with suited aces, yet tightening versus nits; observers have noted this in live streams from the 2026 PCA, where pros deviated only 2% from charts during deep runs. And don't overlook squeeze charts for 4-betting light post-limps and opens, squeezing 8-12% including bluffs like A5s or K7s to maintain balance.
Those diving deeper encounter polarized ranges: value-heavy from early position, bluff-laden from late, with frequencies like 3-bet 9% overall but 70% value/30% bluff to evade exploits, a balance solvers enforce ruthlessly.
Common Pitfalls and Adaptation Strategies
Players often misread charts by ignoring position labels or stack notations, leading to over-folding premiums UTG or spewing chips button-deep, but data from tracking software like PokerTracker reveals that top 1% users customize charts per villain tendencies, widening versus passive fish while tightening to regs. What's significant is rake impact—high-rake rooms demand looser opens to offset fees, as per analyses from the Poker Operations Journal, shifting RFI by 3-5%.
Yet, live play demands adjustments; speech plays and physical tells override charts occasionally, although solvers now include mixed-strategy trainers flashing ranges randomly to build muscle memory. One researcher documented a cohort of students who drilled charts daily, achieving 98% preflop accuracy after two weeks, translating to doubled winnings online.
It's noteworthy that April 2026 saw a surge in app-based chart viewers during the Irish Open, with pros scanning phone screens between hands for versus-3bet defends, blending tech with table dynamics seamlessly.
Conclusion
Preflop charts stand as the unshakeable backbone of No-Limit Hold'em, distilling solver science into actionable visuals that propel players from breakeven to profitable, especially as 2026's packed schedule—from Vegas springs to summer WSOP—tests precision under lights. Those who decode them thoroughly, adapting to stacks, positions, and foes, unlock edges compounding over thousands of hands; turns out, in a game of incomplete info, getting preflop right paves the postflop highway, and the stats back it unequivocally.